Up to this point you have been using tools in the Grid Manager and
Spatial Editor to edit data spatially. There is, however, a different type
of editor in the GFE, called the Temporal Editor, that edits data temporally.
In the editor, the gridded data is presented data time-series format. This
time-series represents the average value over an area that you define (the
current edit area) as a function of time. An example of the Temporal Editor
display can be found below.
The table below briefly describes the components of the Temporal
Editor.
|
Object
|
Purpose
|
|---|---|
|
Time Scale
|
Displays the time in GMT
|
|
Scale
|
Displays the data scale for that Temporal Pane
|
|
Selected TimeRange
|
Displays the currently selected TimeRange
|
|
Temporal Data Selector
|
Controls the visibility of the corresponding weather
element
|
|
TimeSeries Display
|
A plot of the time series for that weather element
over the selected area
|
|
Image Toggle
|
Toggles the display from image to graphic
|
|
Temporal Pane Sizer
|
Changes the vertical size of individual temporal
panes.
|
To get to the Temporal Editor, select the button in the button bar that
looks like the picture at the right. 
When you select this button the Grid Manager will disappear and the Temporal Editor will replace it. To get back to the Grid Manager, just press the same button again. Note that the button will change in appearance each time it is selected. If you see no data displays in the Temporal Editor, use the Select Points tool to define an edit area on the Spatial Editor. The edit area that you select in the Spatial Editor is sampled and averaged to produce the time series display.
The weather elements displayed in the Temporal Editor depend upon the state of weather elements in the Grid Manager, and the Temporal Editor Weather Element Mode.
The different type of visualizations are shown here. Several of the visualizations, such as the TimeBar, show the average value as determined from sampling the grid data over the current edit area. For WEATHER and DISCRETE type of weather elements, the TEColorBar visualization will show the various ratios of different weather and discrete values in the sampling area, as shown below:

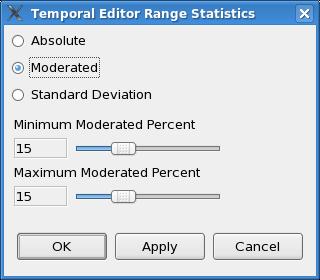
Some of the visualizations, such as the RangeBar as shown below, will show you data distribution information across the edit area. The user can control the statistics chosen to be displayed, from absolute maximum/minimum, to moderated values, and to standard deviation values.

The TE Statistics Dialog, available from the GFE->Viewing Preferences->Temporal Editor Statistics Mode menu, controls the type of statistics that are presented: